Required permission:
- Add dashboard (to use Create widget; without it, clicking it says You don’t have permission)
- Edit dashboard (to edit the dashboard, save the widget on it, and use Edit query)
Create a widget
- Open the dashboard and click Edit.
- Click Add, then open the Custom tab.
- Click Create widget, the first tile in the tab.
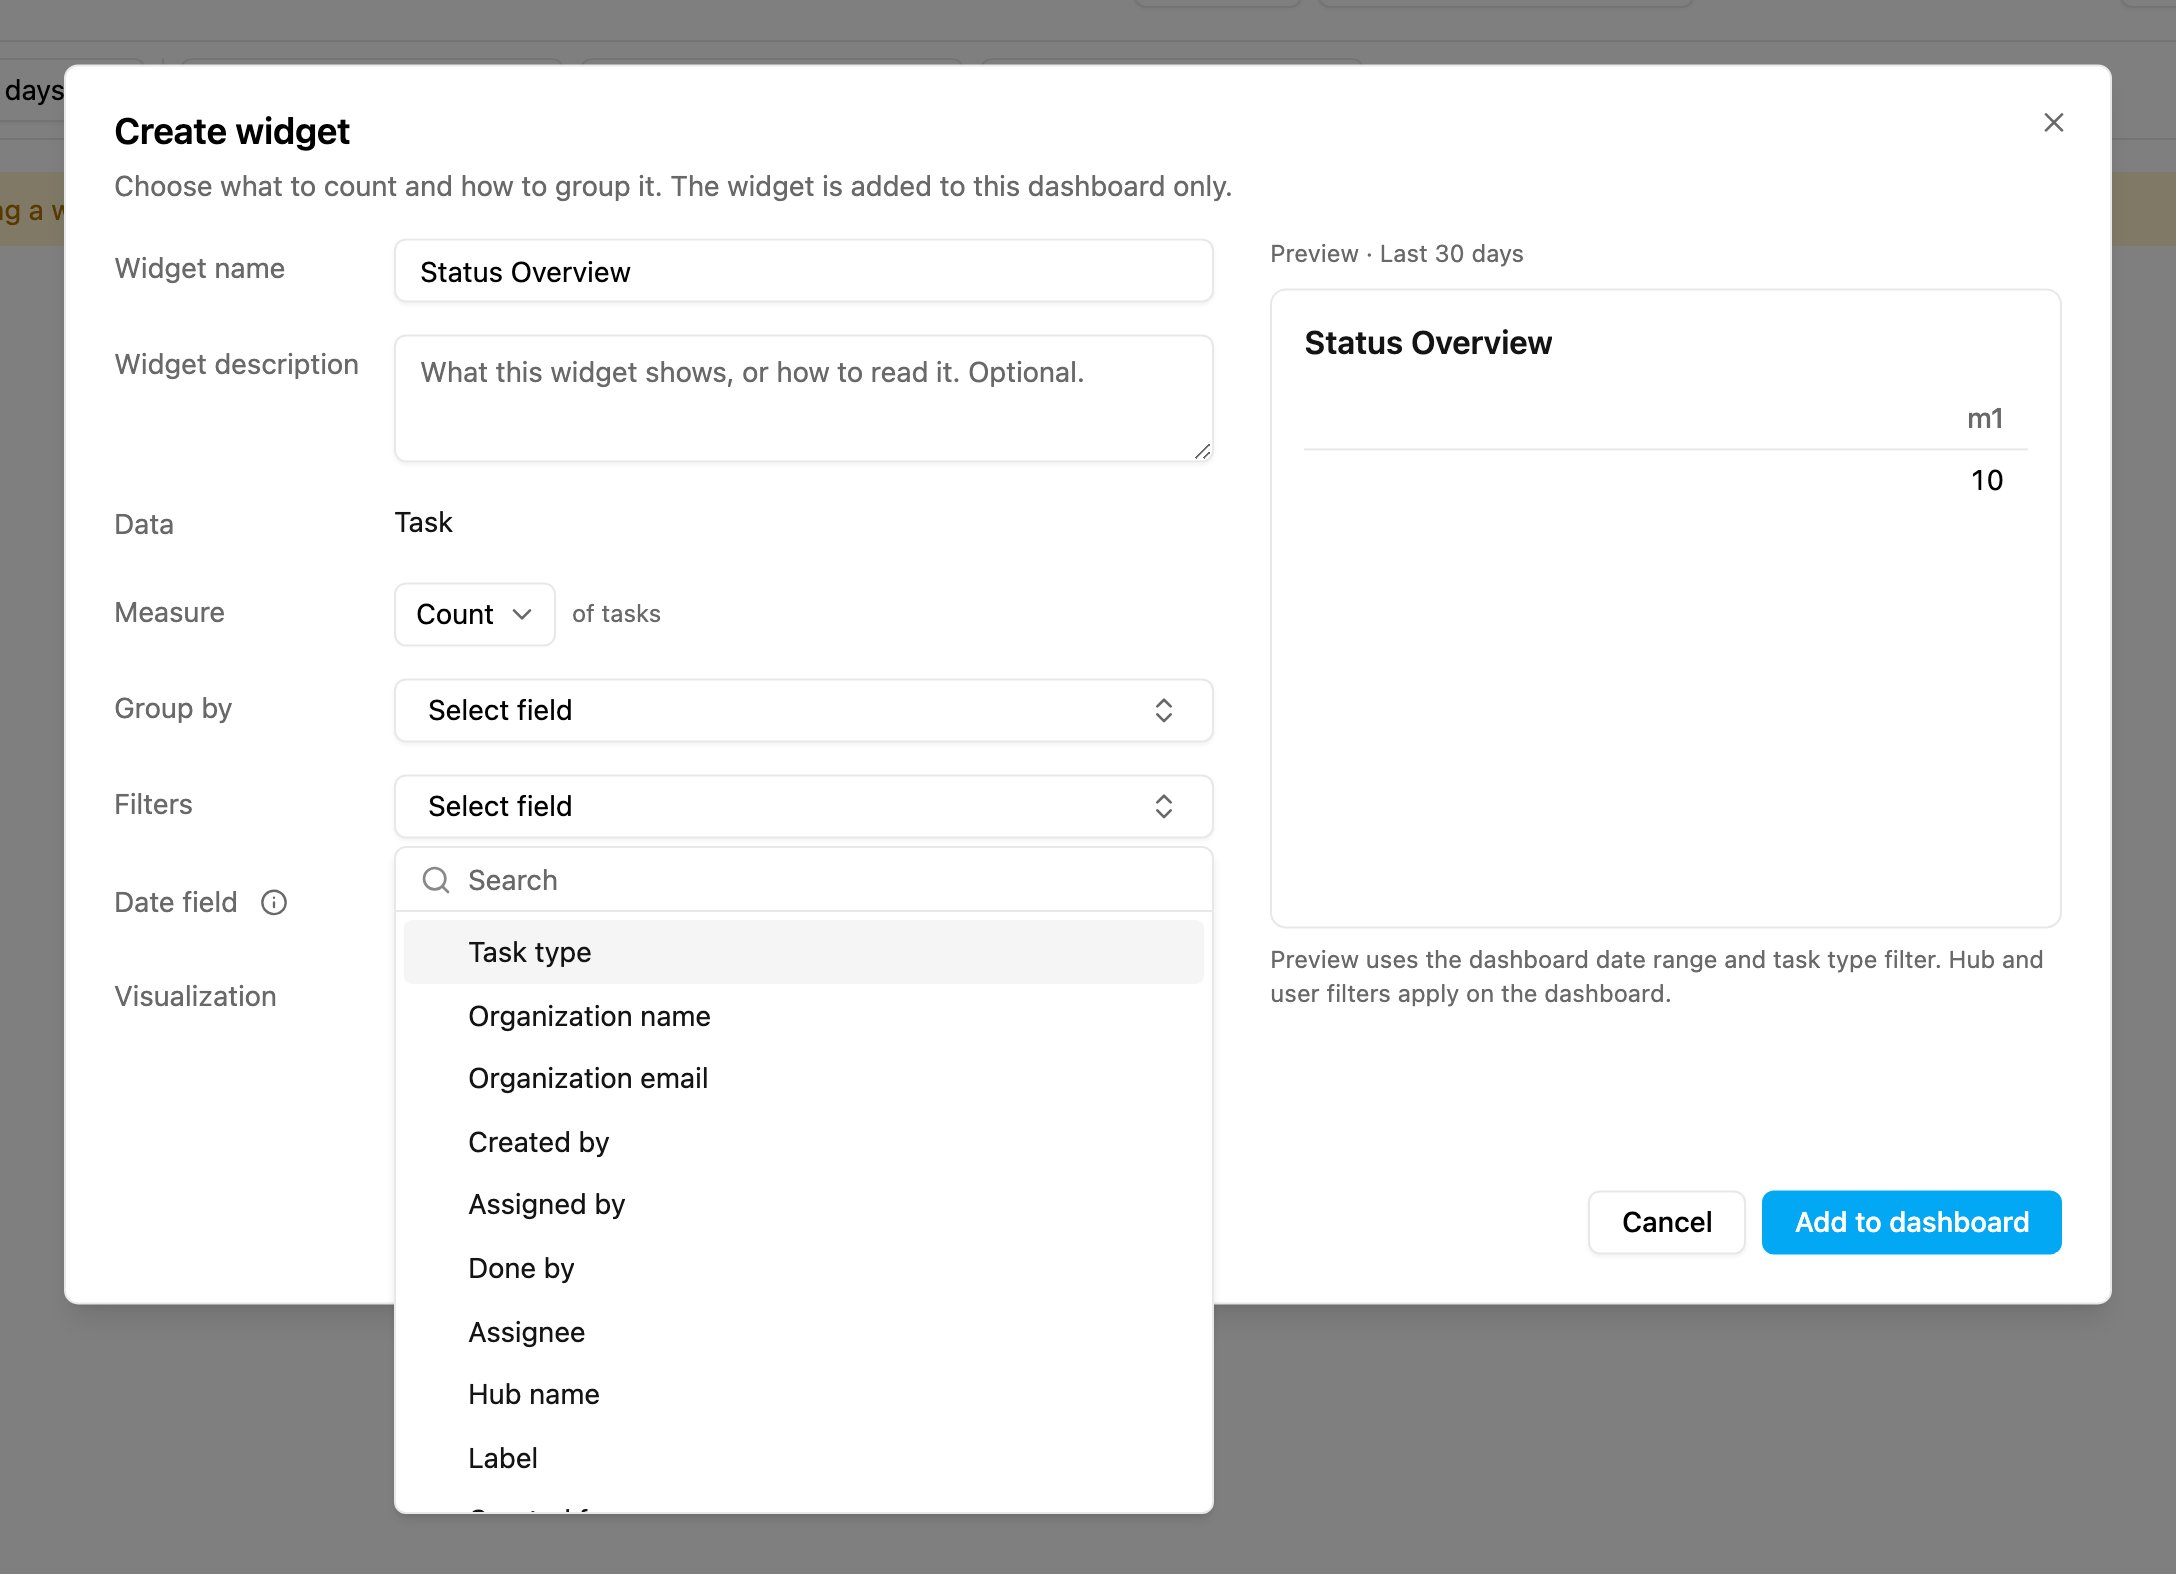
The Create widget dialog: one empty grouping row and one empty filter row, with Flow offered as a filter field.
- Widget name: the title on the widget. Required, up to 200 characters.
- Widget description: up to 500 characters. Optional. It shows in a tooltip on the info icon next to the widget title. Text that is too long is refused with a message when you click Add to dashboard.
- Source: the data the widget reads. Task (Common field) reads all your tasks unless you narrow it with a filter. Users counts the users of your organization. With Big Data on your plan you can also pick one flow, for example Task - Delivery, or a data type, for example Data - Outlets. See Choose a source.
- Measure: what to count. Count counts tasks. Distinct count, Average, Sum, Minimum and Maximum ask for a Field as well. To measure time between dates, use a time measure.
- Group by: the dialog opens with one empty grouping row. Pick a field to split the result; once the row is filled, Add grouping appears for a second one (two at most). A field such as Hub name has a Number of groups (Top 5, Top 10, Top 20 or Top 50). A date field has an Interval: Per hour (only for a date field with a time of day), Per day, Per week or Per month. Remove a grouping with ×. An empty row is ignored.
- Filters: optional. The dialog opens with one empty filter row; once it is filled, Add filter appears for another. Use a filter to count only some tasks, for example Status is one of Done, or Flow is one of Delivery, Pickup. Remove a filter with ×. An empty row is ignored. Without a Flow filter the widget counts tasks of every flow. Only flows of your organization are accepted.
- Date field: the date that decides which tasks fall in the time range, for example Start time or Done time. Point at the info icon next to Date field to see which range applies now.
- Visualization: how to draw the result. A visual that cannot show your settings is greyed out; point at it to see why. For example, a single number cannot show a grouped result. A new widget starts on Table.
Time range and dashboard filters
A custom widget has no time range of its own. On the dashboard it follows the dashboard’s time range and filters like any other widget. The tooltip on the Date field info icon says which range it uses now, for example The time range comes from the dashboard filter (now: Last 30 days). The dashboard’s Flows filter is combined with the widget’s own Flow filter, if it has one. If the two have no flow in common, the widget shows its usual empty state.Preview
The Preview shows the widget with your dashboard’s current data, and updates a moment after you stop changing settings. Its first line names the time range it uses, for example Preview · Last 30 days. The preview has two tabs, Chart and Sample rows. Chart is the widget itself, as described here. See Sample rows for the other tab. The preview uses the dashboard’s time range, the widget’s own filters and the dashboard’s Flows filter. Hub and assignee filters are not used in the preview, but they apply once the widget is on the dashboard. The note under the preview says so: Preview uses the dashboard date range and flow filter. Hub and user filters apply on the dashboard.- Finish every grouping and filter to see a preview.: a grouping or filter is only partly filled, for example a filter field with no value.
- This widget’s query can’t be saved. Change or remove the widget and try again.: the settings would make the query too large, for example Per hour split by 50 hubs over a month. The setting to change is marked Check this setting. Pick a larger interval or fewer groups.
Sample rows
Open Sample rows to see the records behind the widget: at most 20, the latest first by the Date field, for example 20 latest tasks by Start time. They use the same source, filters and time range as the chart. On a Data source the caption reads 20 latest records by Created time and the preview line Preview · All records.- Sample rows are limited in rows, not in columns: they show every column of the source, emails included (for example Assignee or Created by).
- Task (Common field) starts with Flow, Status, Hub name, Label, Created from, Created time, Start time, End time, Done time, Updated time and Travel duration, then the other task columns: Task id, Flow id, Hub id, Title, Content, Assignee, Assigned by, Created by, Done by, Done coordinate and Ref id.
- A location, such as Done coordinate or a location field of the Flow, shows as raw text “lat, lng”, for example -6.2, 106.817. Locations show in Sample rows only: they cannot be filtered, grouped or measured (the map is under Density map).
- A Task - (flow) source leaves out Flow and adds every field of the Flow it can read, under the field’s own title, including a done time per page (for example Page1Done Time). Photo, Signature, Voice, Video, Bill and List fields are never shown.
- A Data - (name) source shows every field of the data type, then Created time, Updated time, Created by and Updated by.
- Users shows Status, Role, Role name, Team, Hub, Email, Name, Language, First login, User ID, Created time, Verified time, Updated time and Last login. Team and Hub show names; a user in several teams or hubs lists them all.
- Rows follow the same access rules as the numbers on the dashboard. You see only tasks or records of your hubs, and when your role may see only its own tasks, only your own tasks.
- Sample rows need the view permission of the source: View task for a task source, View data source for a Data source, View user for Users. Without it the tab says You don’t have permission.
- Too many requests in a short time show Preview is busy with Try again.
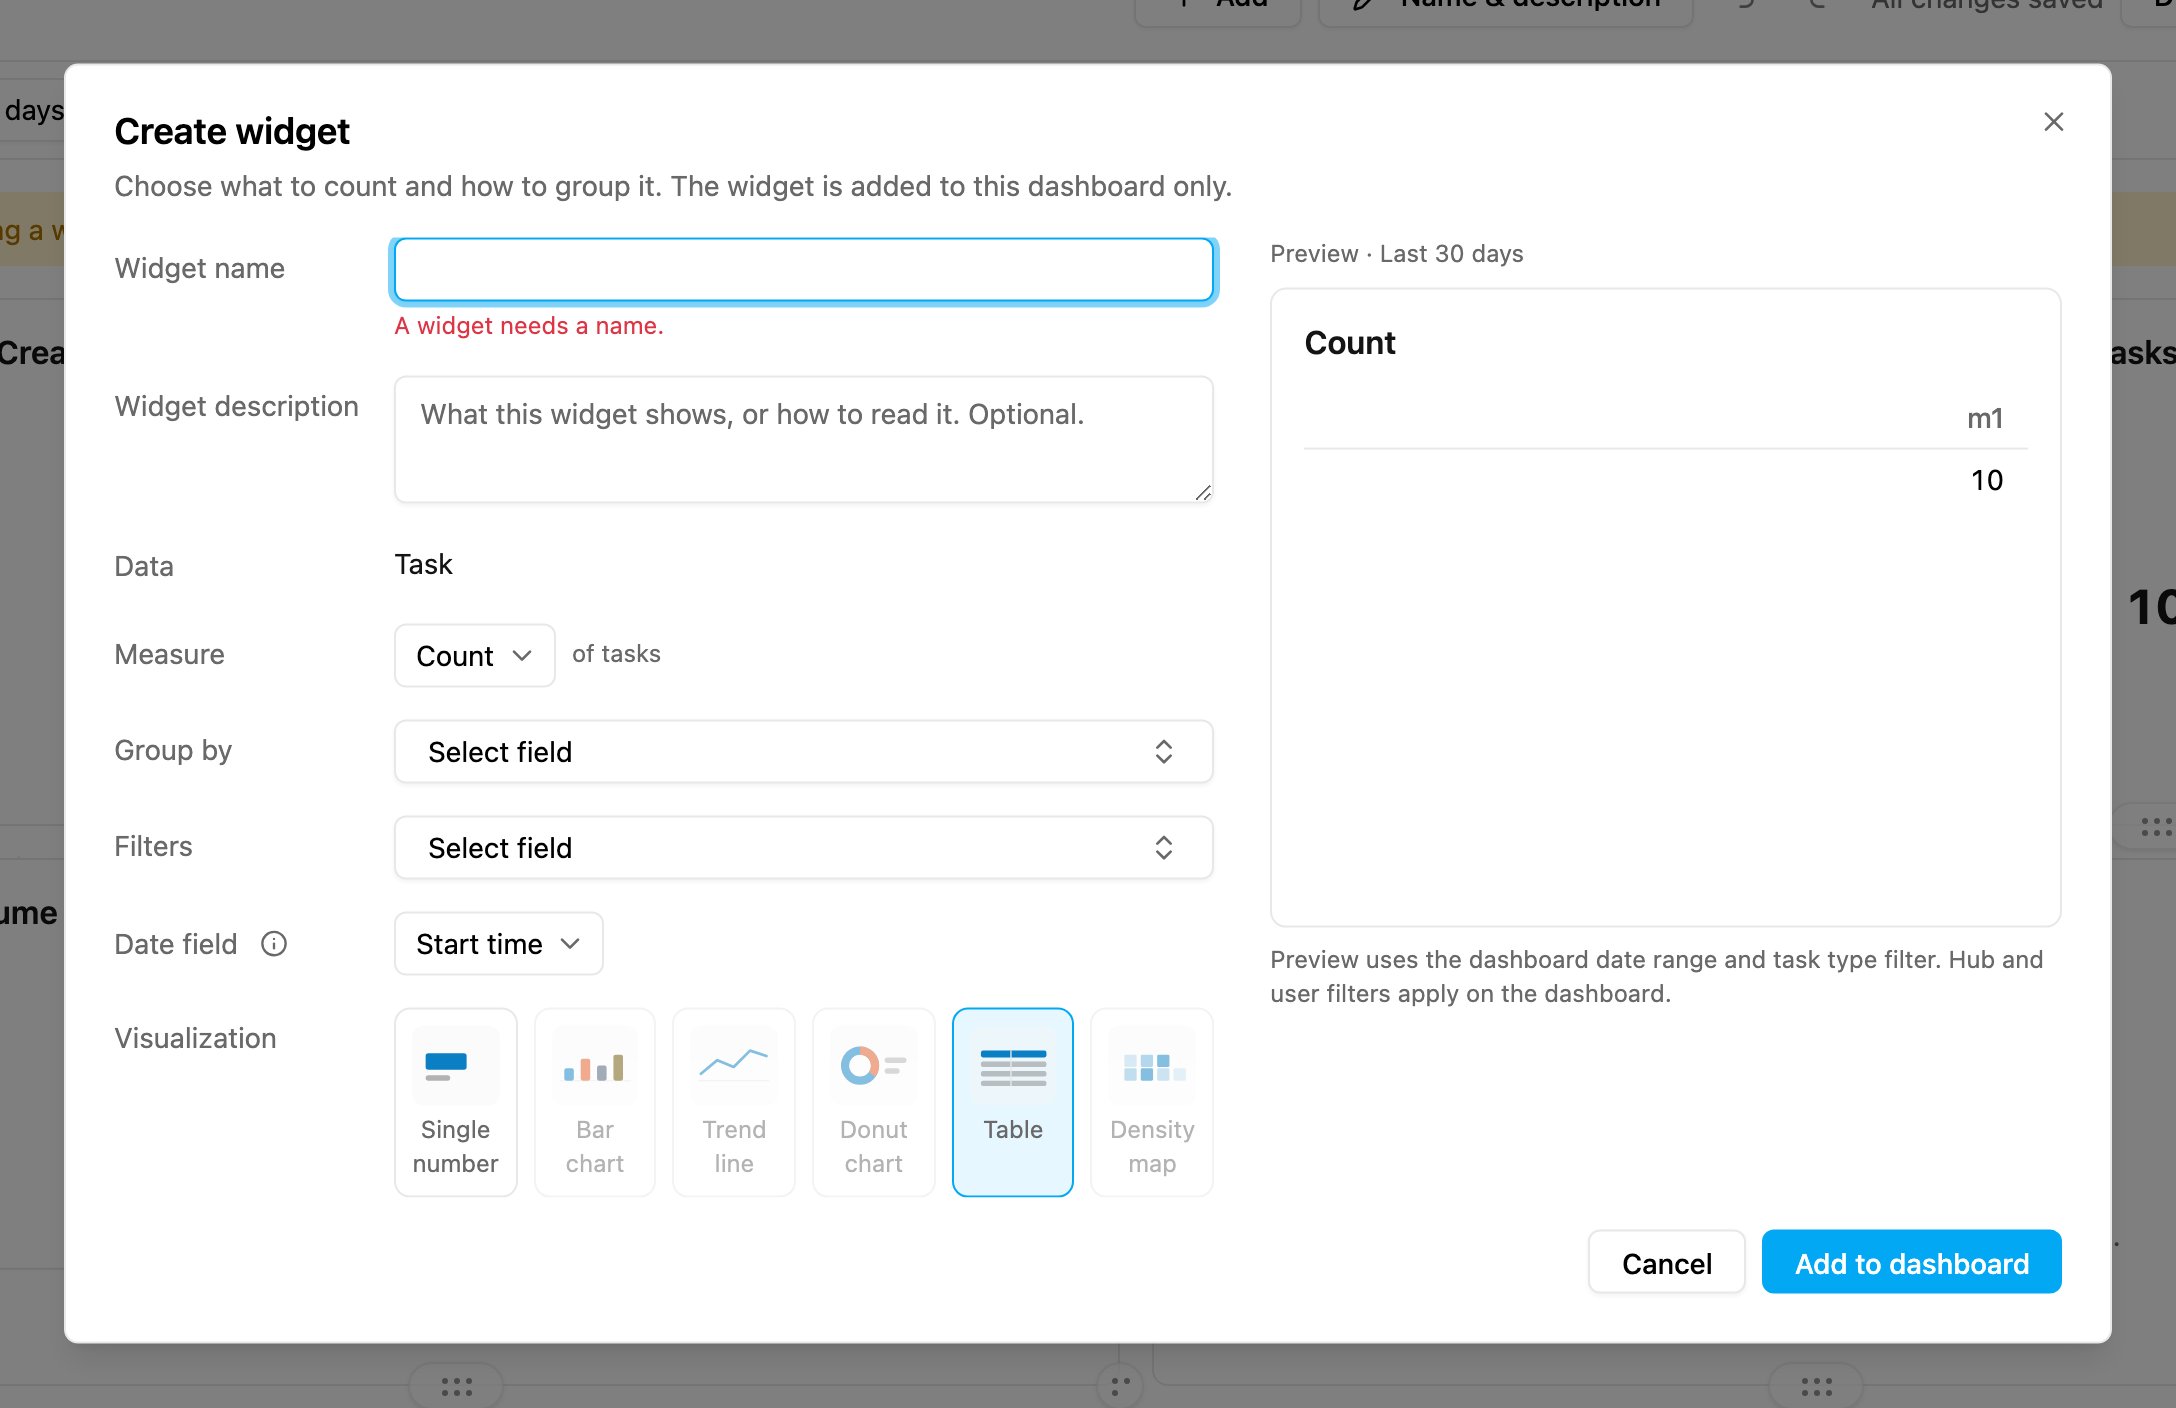
Clicking Add to dashboard with no name marks the field: A widget needs a name.
Choose a source
The Source list decides which records the widget reads.- Without Big Data the list starts with Task (Common field) and Users, then shows every flow and data type of your organization. Picking one of those opens the upgrade window instead: below the Enterprise plan it offers the upgrade to Enterprise, and on Enterprise it says Big Data is not enabled for your organization with a link to contact our sales team. The widget keeps its current source. Task (Common field) with a Flow filter works on every plan.
- A data type that extends a user record is listed greyed out: Data - (name) — extends a user record, not in dashboards yet.
- Picking a source you have no access to says You don’t have permission and keeps the current source. Choosing a task source needs the View task permission, a Data source the View data source permission, Users the View user permission; the numbers of a widget already on a dashboard only need View dashboard (a Users widget that groups or filters also needs View user).
- Changing the source keeps the name, description and visual, and resets Measure, Group by, Filters and Date field.
- A Task - (flow) source offers the usual task fields (no Flow grouping or filter: the source is one flow) and adds the fields of that Flow, under their own titles. How a field is stored decides what it offers (see How a field is stored): a text or choice field can be grouped and filtered, a number field can be summed or averaged, and a date field can be the Date field, a date grouping or an end of From / To (under Time measures). A date field must be stored as a date in every year of data. Photo, Signature, Voice, Video, Bill and List fields are never offered. If no task of the flow was found yet, or the fields could not be checked, the composer says so under the source and offers the standard task fields only.
- Renaming a flow keeps its widgets: the source follows the flow, not its name.
- If the flow is later deleted, its widgets show This data is no longer available. If a date field of the Flow is removed, the widget shows A column of this widget no longer exists. Edit the widget to pick another source or field.
Task fields
The task fields are the ones Report and Export show for a task: Task id, Flow, Hub name, Hub id, Title, Content, Label, Status, Start time, End time, Updated time, Assignee, Assigned by, Created by, Created from, Created time, Done by, Done coordinate, Done time, Travel duration and Ref id (your own id for the task). How a field is stored decides what it offers:- a text or choice field can be grouped and filtered. A field with many different values, such as Task id, Title or Ref id, can only be the first grouping, with at most 50 groups;
- Travel duration can be summed, averaged or used for Minimum and Maximum;
- a date field can be the Date field, a date grouping or an end of From / To;
- Done coordinate is a location: it shows in Sample rows and on a Density map only.
Data widgets
A Data - (name) source reads the records of one data type, for example your outlets or vehicles. The list shows one entry per data type, under its current name; renaming a data type keeps its widgets.All records
A Data widget always counts all records you can see. The dashboard date range does not apply to it.- In the composer the Date field is replaced by the Records row: All records. The dashboard date range does not apply. Count reads of records.
- On the dashboard every Data widget carries the note All records · date range does not apply.
- A date field of the data type can still be a date grouping (Per day, Per week or Per month, or Day of week) and an end of From / To. On a date-and-time field (such as Created time), Per hour and Hour of day need a range filter on that same field of at most 31 days, because the data counts all records. The composer lists them greyed out with needs a range filter on this field (31 days at most), and a widget that has one without that filter shows Hourly grouping on this data needs a range filter on the same date field, 31 days at most. The composer has no range filter control yet, so only a widget whose stored query already carries that filter groups by hour.
- A date-only field (a date with no time of day) never offers Per hour or Hour of day, in any source, including a form date component of a Task - source. A widget that has one anyway shows This date has no time of day. Group it per day or longer.
- Average duration is offered as From / To only, when the data type has at least two date fields (its own date fields and Created time). There is no Average age and no Completion rate on a Data source.
- An empty data type shows No records yet: This data type has no records you can see.
How a field is stored
The fields come from the data type, under their own titles, plus Created time, Updated time, Created by and Updated by. What a field offers depends on how its values are stored, not on how the field was set up:- a text or choice field can be grouped (Group by) and filtered;
- a number field can be summed, averaged or used for Minimum and Maximum. Only fields stored as numbers can be summed or averaged. A number typed into a text field is stored as text, so it can be grouped but not summed;
- a date field can be a date grouping and an end of From / To.
Fields hidden for a role in Restricted fields still appear in dashboards. The dashboard reads the stored data, which knows nothing about hidden fields, so a hidden field of a Flow or a data type is offered in Group by, Filters and Sample rows, and its values show in widgets, to everyone who can open the dashboard. Restricted fields still hide the field in the task list, the data source list and the detail pages.
Who sees which records
- A Data widget counts only the records of your hubs, like a task widget, and the dashboard’s hub filter narrows it.
- A data type shared by every hub (common data) is counted for every hub. The dashboard’s hub filter does not apply to it, and while the hub filter is narrowed its widgets also say Shared across hubs: the hub filter does not apply.
- When a data type is limited to some users, you count only the records shared with you or with everyone.
- Deleted records are never counted.
When the data type changes
- If the data type is deleted, its widgets show This data is no longer available. Edit the widget to pick another source, or remove it.
- If a field the widget uses is removed from the data type, the widget shows A column of this widget no longer exists. Edit the widget to pick another field.
- Neither offers Try again, and the other widgets on the dashboard are not affected.
- In Add › Custom, a widget template on a data type reads, for example, Bar chart · Data - Outlets, and you can find it by the data type name. A template whose data type was deleted reads Bar chart · Source deleted.
Users widgets
A Users source counts the users of your organization, for example users per Status, Role name or Hub. Every organization can pick it, with or without Big Data.- A Users widget always counts all users you can see. The dashboard date range does not apply: the widget says All records · date range does not apply, and in the composer the Date field is replaced by the Records row.
- Count is the only measure. Every field can be grouped and filtered: Status, Role, Role name, Team, Hub, Email, Name, Language, First login, User ID, and the dates Created time, Verified time, Updated time and Last login.
- Status shows the names of Settings › User (Active, Inactive, Invited, Declined); other stored values show as they are.
- Team and Hub show names, and filter from a list of names. A user in several teams or hubs counts once in each of their groups; the composer says so under the grouping.
- Phone number, avatar, passwords, authenticator and permission fields are never offered.
Who sees which users
- A plain count of users needs View dashboard only. A Users widget that groups or filters, and its Sample rows, also need View user; without it the widget shows You don’t have permission.
- When your access is limited to some hubs, you see only the users of those hubs, also in a Hub grouping.
- When you belong to a team, you see the same users as the user list shows you: the users of your teams and the users without a team. The owner always sees everyone.
Time measures
Five measures work with the dates of a task instead of counting it. Pick them under Measure like any other.Average duration and pairs
After Average duration, choose a Pair: the date the time starts from and the date it ends at. The list has two groups. Suggested:
Other pairs: every other order of two dates, for example Done time → Created time. These show a plain duration, never early or late. Last updated time is not offered, because it is not a step of the task.
When you choose a pair, Date field is set to the pair’s end date, and the hint says so, for example Set to Done time to match the pair. That way the widget takes the tasks that ended in the time range. You may pick another date field; the hint then goes away.
A duration shows the two largest units of days, hours and minutes, for example 3d 1h, 1h 20m or 45m. For Lateness vs deadline and Scheduled start → Done, a task done before the date reads 2h 10m early, after it 2h 10m late, and exactly on it On time.
From / To
Under Pair, the Custom group has From / To. Pick any two date fields of the source, for example a check-in and a check-out date of your Flow. The composer shows the name it will use, for example Shows as “Check-in → Check-out”., and the widget column reads Average duration: Check-in → Check-out.- From / To is a plain process duration: the average time from From to To, over the tasks that have both dates.
- If To was on average earlier than From, the value shows with a minus, for example -20m. It never reads early or late.
- Only when From / To are a deadline pair, End time → Done time (Deadline → Done) or Start time → Done time (Scheduled start → Done), the value reads early, late or On time, exactly like the matching suggested pair.
- From / To adds no status rule of its own. Unlike the suggested pairs with Done time in them, it does not keep Done tasks only; add a Status filter if you need that.
- From and To must be two different date fields (From and To must be two different date fields.). Last updated time is not offered.
- Choosing To sets Date field to it, like a pair does.
Average age
After Average age, choose Age since created (how long an open task has existed) or Days past deadline (how long an open task is past its deadline). Age is measured from now, so it only counts open tasks already past that date: a task not yet due never reads as late. Age has no trend over time; a line chart is not offered for it.Groupings by time
Under Group by, a date field offers three more groupings next to the usual interval. They are shown as the field and the grouping, for example Created time · Age or Done time · Hour of day.- Hour of day and Day of week add up all days of the range into one 24-hour or 7-day cycle. They follow the time zone of your browser, so two people in different time zones can see different hours.
- Age counts how long ago the date was, up to now. To see only open tasks, add a Status filter, for example Status is one of Unassigned, Ongoing.
- A widget can have only one date grouping when one of them is Hour of day or Day of week. Otherwise the composer says Hour of day and Day of week cannot be combined with another date grouping. Group the other one by a non-date field.
- Distinct count and Average cannot be added up across hours or weekdays. With Hour of day or Day of week, use Count, Sum or a time measure; otherwise the composer says This measure cannot be added up across hours or weekdays. Choose Count, Sum or a time measure.
Based on N tasks
An average of few tasks can mislead, so a time measure shows how many tasks it is based on.- A single number shows Based on N tasks under the value. When fewer than 5 tasks were used, a Few tasks chip appears next to it.
- In a table, point at a time value to see Based on N tasks and, below 5, Few tasks.
- When no task fits, the widget shows — and Nothing recorded, never 0m.
Sorting tables
Click a column header of a table widget to sort its rows: first ascending, then descending, then back to the original order. Durations sort by length, early before late; hours from 00 to 23; days from Mon to Sun; age from Under 1 day to 7 days or more. Empty values stay last. The sort is not saved with the widget. A ready-made table that lists the top 10 by a time, such as Completion Time by Flow, first takes the 10 Flows (or hubs, or staff) with the most tasks and then orders those 10 by the time. Its note says so, for example Top 10 by task count, ordered by Average duration: Completion time (Created → Done).Limits
Time measures are averages only: no median or percentile, no min/max of a duration, no on-time count, and age counts only tasks in the dashboard range.Edit a widget’s query
You can change what a widget counts, not just its name.- In edit mode, click the widget’s ⋯ and choose Edit query.
- The Edit widget query dialog opens with the widget’s current settings and its saved visual.
- Change what you need and click Apply changes.
- Click Save to keep the change, or Discard to drop it.